Analyzing the success of your sources
Teamio will show you both quality and quantity. That is, where most job seekers come to you from, but also the sources of the most adequate applicants. Or what are the most common reasons for rejection. That way, you know where best to spend your budget, and you have a strategic HR management argument to hand.
Statistics summary for quick reference
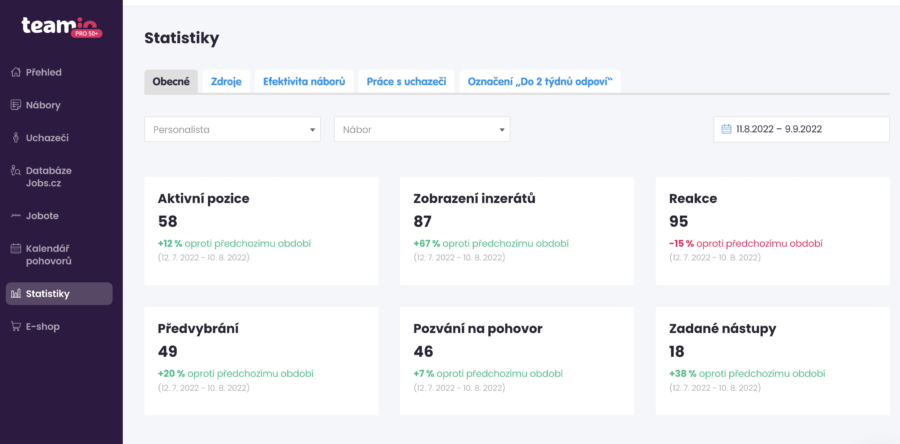
A quick glance and you know. On the Statistics home screen, you’ll find a statistics summary that show the trend of all your company’s recruitment over the last 30 days.
- Choose any period as you require
- Filter only the recruitment campaigns of a specific recruiter
- Select one specific recruitment campaign and track the trends over time

Applicant source analysis
You’ll love these two charts. They show you where your applicants came from and, most importantly, where the ones you eventually recruited came from. Next time you’re deciding where to allocate more money, look here first.
- Track which applicant sources are strongest
- The basis for deciding which source to focus upon
- Also available for older recruitment campaigns that you want to copy and restore
Recruitment effectiveness
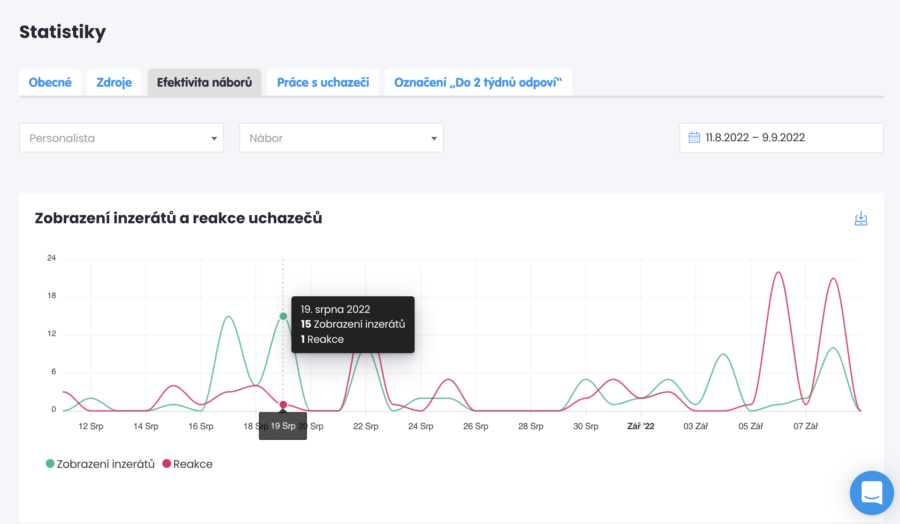
A place to quickly find out if there’s a problem. A fundamental mismatch between impressions and responses may indicate errors in the text of the advert or a poorly set up recruitment campaign.
- How many times has our advert been displayed?
- How many responses did we get?
- Is there a problem somewhere?
- Do we need to update or re-share the advertisement?
Working effectively with applicants
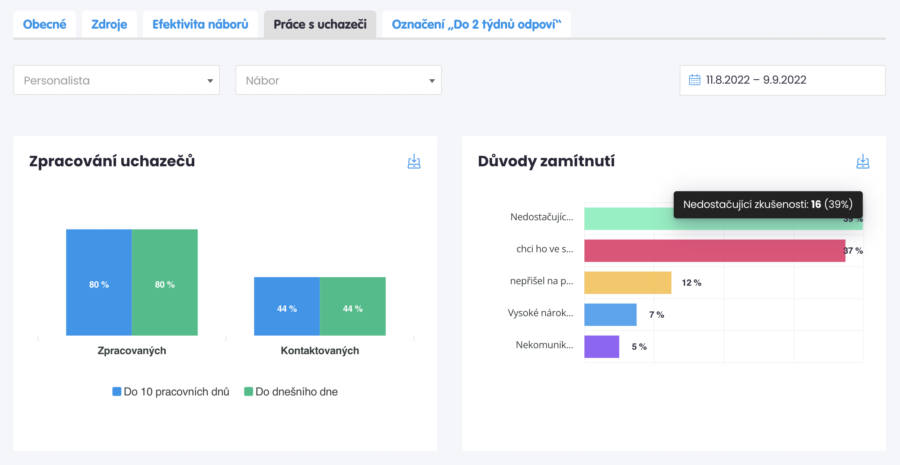
Important data when you need clarify where your reserves are. And a vital weapon in negotiating the wage options on offer.
- What are the most common reasons not accepting an applicant?
- Do you need to adjust your pay or entitlements?
- Are you communicating quickly enough?
Ready to take your recruiting to the next level?
Let’s make a call. We’ll show you how to reach higher goals with Teamio. Try Teamio for 30 days for free.


